Hello, welcome to my blog. In this post I will introduce the
concept of multiple linear regression. First, let me do a brief recap. In the
last two posts, I introduced the concept of regression which basically is a
machine learning tool used to find the relationship between an explanatory (also called predictor, independent) variable and a response (or dependent) variable by modelling the relationship using the
equation of a line i.e.
y = a + bx
Where a is the
intercept, b is the slope and y is our prediction.
Up until now we have sort of used only one explanatory
variable to predict the response variable. This really is not very accurate
because if (for example) you are trying to predict the price of a house the
square footage of the house is not the only feature that determines it price.
Other attributes like number of bedrooms, bathrooms, location and many other
features will contribute to the final price of the house.
Regression that involves the use of more than one explanatory
variable is called multiple linear
regression. In this case, the relationship between the explanatory
variables and the response variable will be in the form shown below:
y = a+b_1*x + b_2*x + b_3*x + ... + b_n*x
Where a is still our
intercept, b0 up to bn stands for our explanatory
variables and y is our prediction. Note
that the number of explanatory variables will be the number of features we are
using for prediction. If we are using 5 features then we have 5 explanatory
variables and we will have b1 up to b5 in our equation.
To make this concept clearer I will be implement multiple
linear regression using Python with pretty much the same libraries as before. I
will also use the same dataset i.e. the dataset containing information about
house sales in King County, Seattle.
First let’s import the required libraries as shown in the
screenshot below:
I
will go to straight to implementing multiple linear regression. Preliminary
steps like inspecting the dataset by checking its shape, viewing the first few
rows were covered in the previous post. If you have not read it, you can read
it here.
A Quick Aside
Before we perform multiple linear regression, let me briefly talk
about some of the features I used in my model. I used 8 explanatory variables
for predictions but only 7 featured were actually used in the model. How? Because
I combined some features i.e. some features were ‘joined’ to make a new feature.
Let me talk about them:
- bedrooms*bedrooms: This has the effect of making a difference between not many bedrooms e.g. 1 and not many bedrooms e.g. 4 since 12 = 1 and 42 = 16. We are doing this so that houses with more bedrooms ‘get more weight’ so to speak. This means houses with many bedrooms will be affected by this feature.
- bedrooms*bathrooms: This value is large when both values are large. So houses with many bedrooms and bathrooms will also ‘get more weight’ like before. This kind of variable is called an interaction variable.
- log_sqft_living: This has the effect of grouping similar values together and separating them from other values. For example, log(1000) and log(1200) ≈ 7 while log(2000) and log(2200) is around 7.7. This feature will cause the difference between houses with small and high square footage values to be more distinct.
This is a very wonderful property of regression. It allows
you to manipulate with explanatory variables such that you can get a better fit
to the data. Before we start let me list the features I am using for my model.
They are: bed_bath_rooms, log_sqft_living, Condition, Grade, Floors, bedrooms_squared
and View.
Performing Multiple Linear Regression
Now we can perform linear regression. Just like before we use
the ols() function from statsmodels.api library to perform regression.
Remember, it’s all done in one line! The only difference is that we separate
each explanatory variable with a ‘+’ sign to indicate that we are performing
multiple regression.
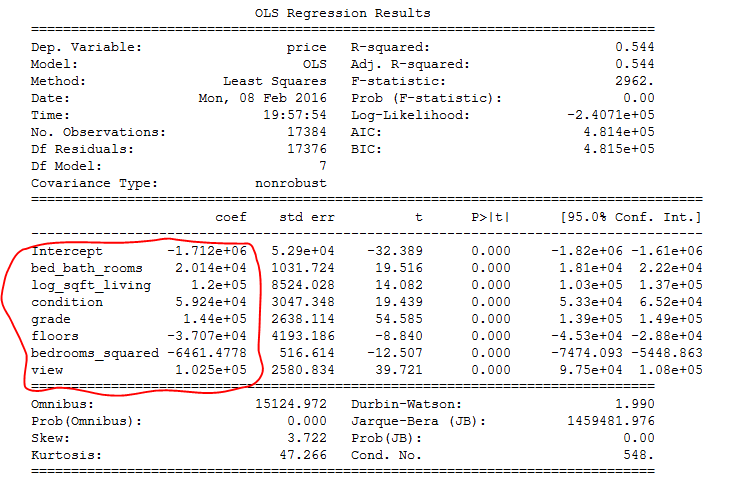
Now we have performed multiple linear regression. The
coefficients of our equation are the values I circled in red. Let’s make some
predictions!
MAKING PREDICTIONS USING OUR MODEL
To make predictions, I will use the predict() function of the
‘model’ object. This function can be used to make predictions using our model.
We simply just give it a DataFrame containing test data and it does the job of using
our model to make predictions using the best fit equation.

The model predicted the price of the first house to be
$351,302 ≈ $351,000 which is not too far from the actual price of $310,000. In
fact, this is slightly better than our previous model (which used only square
footage for prediction) that predicted $356,000 for the same house.
CONCLUSION
Now you know how to implement multiple linear regression in
Python (remember, in just one line!). Hope you enjoyed reading this post. If
you have any question or there was something unclear to you, feel free to leave
a comment. Thanks once again for visiting my blog. Have a wonderful week ahead.
Cheers!!!
No comments:
Post a Comment