Hello once again. Welcome to my blog. In the last post I
introduced linear regression which is a powerful tool used to find the
relationship between a response variable
and one or more explanatory variables.
In this post, I will demonstrate how to implement linear regression using a
popular programming language – Python. To perform linear regression in Python I
will make use of libraries. You can
think of them as plug-ins that are used to add extra functionality to Python.
The libraries I will be using are as follows:
i.
Pandas
(for loading data)
ii.
Numpy
(for arrays)
iii.
Statsmodels.api
& Statsmodels.formula.api (for linear regression)
iv.
Matplotlib
(for visualization)
For this demonstration, I will use the King
County House Sales data to predict the price (in dollars) of house using just one
feature – square footage of the house. This dataset contains information about
houses sold in King County (a region in Seattle). This dataset is public and
can be accessed by anyone (I think a Google search should provide a link to
where you can download it from). It’s in a CSV format (CSV stands for comma
separated values). To load the dataset we use the Pandas library. Once we have
loaded the dataset we can now use it to perform linear regression.First let’s import the required libraries as shown in the screenshot below:

Next we load the dataset using pandas’ read_csv method (make
sure you have the file in your working directory when you do this, or else
you’ll get an error).
After we load the dataset, we can do some preliminary
inspection by viewing the first few rows and checking how rows and columns the
dataset has using the head() method & shape attribute respectively. The
ellipsis (…) represents columns that were omitted because there’s not enough
space to display them. The shape attribute of our data tells us our dataset has
17,384 rows and 21 columns.

Finally, it’s always good to visually display our data using
a plot. This helps us to see for ourselves the general trend of our data. Since
we are using square footage to predict the price of houses in the dataset, we
are going to make a plot of square footage against the price for houses in the
data.

From the plot, we see that the price of a house generally increases
with the square footage. This makes sense because bigger houses cost more than
smaller houses.
Performing Linear Regression
Let’s get to performing linear regression proper. One of the
many things I love about Python is the fact that we can perform so much in just
one line of code. With that in mind, let me show you how to perform linear
regression (in just one line!) using Python.
The statsmodels.formula.api library has a method ‘ols()’
which performs Ordinary Least Squares (OLS) Regression. We call this method and
pass two arguments to it. First, we tell the method which columns of the data
we want to use in the format – ‘Dependent_Variable
~ Independent_Variable’. The dependent variable is what we want to
predict while the independent variable
is what we use for prediction. Note that they must be enclosed in single quotes (‘’) and be separated by a tilde
(~). Next, we specify the DataFrame (the dataset we loaded) we are working with
and call the fit() method to get the fit parameters for our model. All this is
done in one line! Finally, we ask Python to print the results.
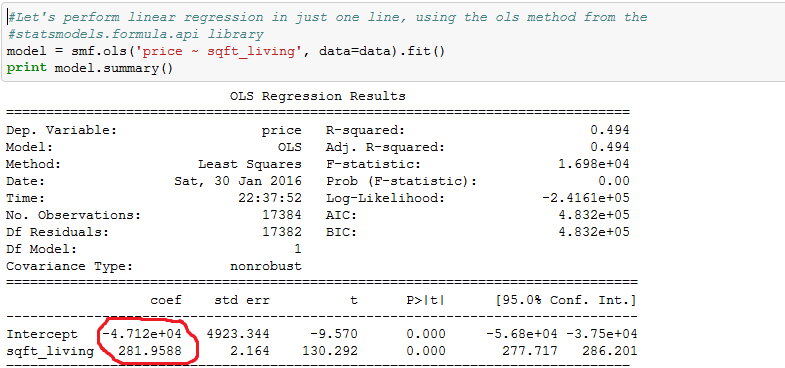
INTERPRETING RESULTS OF BASIC LINEAR REGRESSION MODEL
Now that we’ve performed linear regression, the next thing
for us is to interpret results we got. I want to draw your attention to the
values I circled in red (Intercept and sqft_living). Remember I said in the
previous post that linear regression tries to model the relationship between
the dependent variable and the independent variable using the equation:
y = a + bx
The ‘Intercept’ stands for a, while the value ‘sqft_living’ stands
for the coefficient of x i.e. b. Therefore, we can write the equation
that relates square footage and price (in our dataset) as:
y = -47120 + 281.9588*x
This equation gives us the best fit line for our dataset. We can
visualize this by plotting this line on our dataset.

TESTING THE MODEL
Now that we have the equation that best fits our dataset, let us
do some prediction. Let’s take a house
from the test dataset (the same King County data) with a square footage of 1430
sq. ft. and try to predict how much it will cost. Using our equation above, we
can predict it cost – (-47120 + 281.9588 * 1430) = $356,081.084 (approximately
$356,000). The actual price of the house is $310,000 which is not too far off
from our prediction. In fact if we properly account for more features of the
house e.g. number of bedrooms, bathrooms etc. we may make a prediction that is
closer to the true value.
Conclusion
Now you’ve seen how to implement linear regression in Python in
just one line! Pretty cool! Hope you’ve enjoyed this post. If you did or need
any further explanation, feel free to leave a comment. Thank you and have a
wonderful week ahead.
No comments:
Post a Comment