Hello once again. How has your week been? Hope it has been
good. Thanks for visiting my blog once again. Today I would like to talk about
one of the most popular and useful machine learning algorithms – Linear
Regression.
First, what is regression? Regression basically describes the
relationship between numbers. For example, there is a relationship between
height (a number) and weight (another number). Generally, weight tends to
increase with height. Formally, regression is concerned with identifying the
relationship between a single numeric variable (called the dependent variable, response or
outcome) we are interested in and one
or more variables (called the independent
variable or predictors). If there is
only a single independent variable, this is called simple linear regression, otherwise it’s known as multiple linear regression.
What we assume in regression is that the relationship between
the independent variable and the dependent variable follows a straight line. It
models this relationship using the equation below:
y = a + bx
Where,
y – the dependent variable
a – intercept, this is the value of y when x = 0
b – slope, this is how much y changes for an increment in the
value of x
How Regression works
The goal of regression is to find a line that best fits our
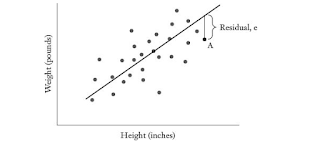
data. Let me illustrate with the following scatterplot showing the relationship
between height (in inches) and weight (in pounds)
From the scatterplot, it can be seen that weight generally
increases with height and vice-versa. Now how do we find the line that best
fits this data? This is done by finding the line has the lowest sum of squared
residuals. Let me explain, the equation for y
shown above generates the predicted value for y which will differ from the actual value of y by some value (called residual
or error). This value is squared and
summed for all points in our data and a line that has the lowest sum of squared
errors is chosen. This is done by adjusting the values of a and b to values such
that they gives a line that fits our data. Let’s show the same data fitted with
the line of best of fit.
Although the
fitted line does not pass through each point in the data, it does a pretty good
job of capturing the trend in our data.
How to choose a and b
Earlier on I said we choose line with a and b such that it
gives the lowest sum of squared errors. How exactly do we do this? There are three
ways:
1. Ordinary least squares estimation.
2. Gradient descent.
3. The normal equation.
I won’t go in depth in describing this methods but a Google
search for any of these terms will give you more information if you are
interested in knowing more about them.
Congratulations!!! Now you know about linear regression one
of the most powerful tools in machine learning. In the next post, I will
demonstrate how to perform linear regression using a popular programming
language – Python. If you have a question please feel free to drop a comment.
Thanks once again for visiting my blog, hope you have a
wonderful and productive week ahead. Cheers.


No comments:
Post a Comment